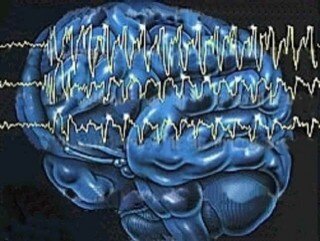
What is QEEG Brain Mapping?
A QEEG is an FDA-approved, evidence-based diagnostic tool that measures the speed and processing efficiency of neuronal brain function and may be used to evaluate a person's brainwaves (EEG) and determine to what extent the individual's brainwave patterns differ from normal.
Electrical activity generated by the body’s muscles as they contract are recorded as an electromyogram from sensors attached to the skin over the muscles and may be shown graphically in the form of an electromyograph (EMG). The electrical activity created by contractions of the heart are recorded as an electrocardiogram and may be shown as an electrocardiograph (ECG). In a similar fashion, the raw unfiltered electrical activity generated by the brain is recorded as an electroencephalogram and may be shown as an electroencephalograph (EEG).
The EEG is measurable at the surface of the scalp and reflects the continuous electrical activity of the brain and such recordings have long been used to measure and study the electrical activity of the outermost layer of the brain-- the cerebral cortex. The electrical rhythmic brain waves measured from each electrode on the scalp reflect the massed activity of postsynaptic potentials of neuronal dendrites in the underlying cerebral cortex. This is somewhat similar to how microphones in each section of a stadium will pick up the roar of the crowd-- more clearly the crowd in the section in front of each microphone and less so the crowd in other parts of the stadium.
A standard EEG will record the electrical activity of the cortex from 19 electrodes placed at specific locations over the scalp as determined by the International 10-20 EEG Electrode Placement System (i.e., 10-20 system) and each electrode measures the summed activity from about a million neurons in the cortex beneath it.
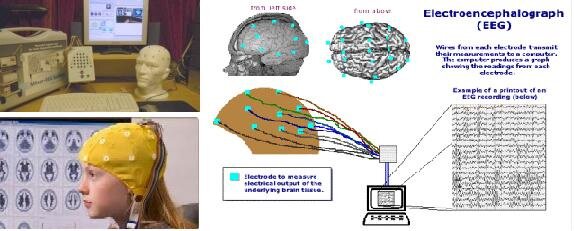
Electroencephalographs showing the raw unfiltered EEG signal are called clinical EEGs and are often used in hospital settings by neurologists to evaluate epilepsy or determine if there is serious brain pathology, such as a tumor. In these applications, the raw EEG tracings from multiple recording sites over the scalp are visually examined by a neurologist for abnormal sharp waveforms or spikes and waves appearing in the tracings from one or more electrodes that might indicate an underlying brain disorder. The EEG is used only for testing in most hospital settings and neurologists are primarily interested in wave morphology (i.e., shape). Certain abnormalities in wave morphology may be indicative of an underlying problem such as a seizure focus in epilepsy, migraine, or a brain tumor, for example. Clinical EEGs are also sometimes used in hospital settings to evaluate altered states of consciousness, including anesthesia, coma, and brain death.
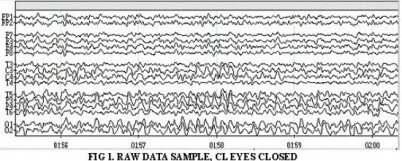
It is well established that the speed of the EEG waveform (brainwaves), measured as the number of times per second that the wave goes from one peak to the next (i.e., cycles per second or Hertz or Hz), reflects the degree of activation of the area of the brain under the electrode. Slower or lower frequency brainwaves (fewer cycles per second) such as Delta (1-4 Hz), Theta (4-8 Hz) or Alpha (8-12 Hz) brainwaves indicate lowered blood flow (reduced perfusion) and fuel use (glucose uptake) in that part of the brain. Faster brainwaves such as Beta waves (>12 Hz) shows increased brain activity. These types of brain electrical activity also reflect the level of arousal of the person: Delta activity accompanies deep sleep, Theta activity accompanies states of drowsiness and deep relaxation, Alpha is asociated with relaxed but awake states, lower Beta (13-16) is associated with relaxed but attentive focus, middle Beta (15-20 Hz) with an engaged or active stae of mind, and higher Beta (>22 Hz) with an excited, hypervigilant, or urgent/emergency state of mind.
In the EEG of healthy adults in a relaxed waking state, the activity consists mainly of alpha waves in the 8-12 Hz frequency range and some faster beta waves in the 13-30 Hz frequency range with relatively few theta waves in the 4-8 Hz frequency range and almost no visible delta waves in the 0.5-4 Hz frequency range.
Epileptiform activity consists of sharp waves or a spike and wave pattern. This is a specific sign of epilepsy if the patient also has seizure symptoms which can fit the diagnosis. Because the probability of finding epileptiform activity in a patient with epilepsy increases if the EEG is recording while the patient is sleeping, neurologists doing clinical EEGs in medical clinics will often ask the patient to forego sleep the night before the EEG so that they will be tired and fall asleep during the EEG recording.
Sometimes intermittent and paroxysmal waveforms that appear epileptiform in nature are seen in the EEG of individuals who do not have seizure symptoms and, certainly such abnormal EEG can be quite common in the EEG of children and adults with neuropsychiatric disorders such as ADHD, autistic-spectrum disorders, bipolar disorders, and psychoses. Such paroxysmal activity can give rise to temporary impaired consciousness, automatisms, affective changes, confusion, amnesia, fear, or schizophreniform disorder symptoms. When seen in the temporal lobes, such epiletiform activity can manifest in sudden anxiety and fear or deep despair. From the frontal lobes, such EEG abnormalities may be associated with impulsive or bizarre behaviours.
In the last three decades or so, a more advanced form of EEG has been developed to give us another way of looking at the EEG data recorded from multiple locations over the scalp, Called "quantitative electroencephalography" (QEEG), this advanced EEG method first digitizes the raw EEG signal and then applies highly sophisticated Fourier Transform or Wavelet quantitative signal analysis to the digitized electroencephalogram to estimate the frequency spectrum of the EEG and produce topological representations of the distribution (brain maps) of various derived spectral components such as absolute and relative EEG power, power asymmetry, coherence, phase, and peak alpha frequency. These quantitative features of an individual's EEG may also be compared to a reference database for deviation from statistical normality.
In this way, we are able to use highly sophisticated mathematical and statistical techniques to analyze the complex background EEG activity of the cortex and reveal patterns invisible to the naked eye and make multiple comparisons between individuals and normative or selected reference databases. The resulting patterns of dedviation from norms can be shown in the form of topographs.
An example of topographic mapping that most of us are familiar with is provided by the colorful daily weather maps shown in many newspapers or on television. Average temperature gradation is depicted topographically on a national map based on a mathematical computation. It is similar when converting the raw EEG activity into a QEEG brain map.
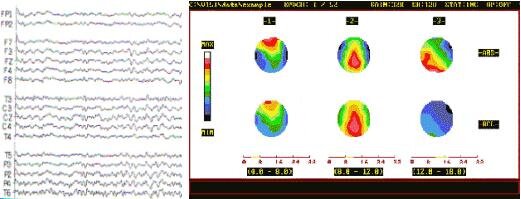
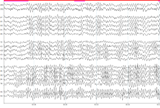
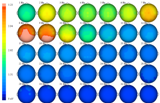
The illustration below, shows the raw EEG data as recorded from 19 scalp locations over the brain cortex and an example of how these data might look after the computer analyzes the EEG and converts the raw data into a topographical brain map showing the distribution over the cortex of different relative amplitudes of selected EEG frequency bands in different colours from black for the lowest amplitude to white for the highest.
It is important to make a clear differentiation between QEEG tests of the brain and other commonly used, and perhaps more familiar, medical brain imaging technologies. For example, x-rays, Computerized Axial Tomography (CAT) scans and Magnetic Resonance Imaging (MRI), are all used to examine brain anatomy, or structure— they are “structural imaging” techniques that allow us to “see” the physical structure of the brain. The QEEG, on the other hand, measures brain activity, or function. QEEG is a “functional imaging” technique that looks directly at brain activity or metabolism in “real time”. Other functional imaging techniques that are used in research and sometimes in hospitals are Positron Emission Tomography (PET) scans, Single Photon Emission Tomography (SPECT) scans, and Functional Magnetic Resonance Imaging (fMRI) techniques. These are all much more expensive and complex imaging techniques that look at blood flow or glucose uptake in the brain to give us a time-averaged look at brain metabolism.
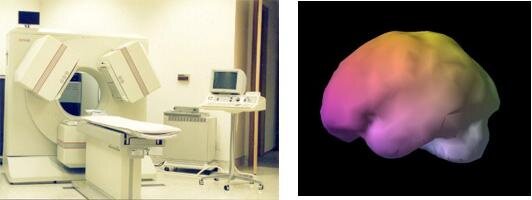
A SPECT camera and a colourized SPECT image of the left side of the brain.
The QEEG does not assess the structure of the brain, but rather, evaluates the manner in which a particular person’s brain functions. It is not designed to diagnose tumors or other structural medical conditions, but rather, gives us the ability to view the dynamic changes taking place throughout the brain cortex while at rest or during the processing of cognitive tasks and can assist in determining which areas of the brain are fully engaged and processing efficiently.
Physical injury to the brain, such as concussion, disrupts the normal flow of electrical impulses in the brain tissue. Similarly, toxic injury, seizure disorder, dementias and Alzheimer's disease, anoxia and brain infections also cause alterations in brainwave activity. Such psychoneurophysiological disorders as ADD/ADHD, ASD, LD, OCD, anxiety, and depression appear to have brainwave patterns or "signatures" that can be detected with QEEG neurometric analysis.
The QEEG reveals "...a level of specificity and sensitivity that is comparable to sonograms, blood tests, MRIs and other diagnostic measures commonly used in clinical practice." (Thatcher, Moore, John, et al., 1999).
While not intended as a "stand alone" diagnostic or as a substitute for clinical judgment, medical opinion or other medical diagnostics, the QEEG is a helpful adjunct which can guide diagnosis, prognosis and treatment. While not at all routine in Canadian medical institutions, QEEG technology has become quite common as a diagnostic tool in many private American hospitals and is now routinely used in American Veterans' Affairs hospitals to evaluate brain trauma and PTSD in injured soldiers.
Combined with other medical, psychological and neuropsychological data, the QEEG is used by those in professional practice for the following clinical applications: evaluating effects of medications and predicting medication response, head traumas, cognitive and psychiatric changes, neurodevelopmental disorders, neurotherapy, peak performance training, and predicting protocols for EEG neurofeedback training or neuromodulation therapies (Gunkelman, 2002).
How is the QEEG Brain Map Produced and Used?
Quantitative Electroencephalography (QEEG) is a brain imaging technique that provides a wealth of information regarding brain function that allows us to better understand an individual's experienced symptoms and behavior. Creating a map of the brain’s electrical activity is actually fairly straightforward and takes only a couple of hours. It is also completely non-invasive and pain-free.
To perform a QEEG mapping procedure, electrodes, also known as sensors, are typically positioned on the client’s scalp at 19 standardized locations designated by the International 10-20 Electrode Placement System (see below). This is usually accomplished by placing a special tight Lycra cap, much like a bathing cap, on the client’s head. This cap has all the electrodes already attached in their proper position and is then connected to a differential amplifier and computer with a special cable. The electrodes in the cap make contact with the skin of the scalp by means of a special gel that reduces the electrical resistance between the electrode and the skin. The electrodes pickup the very faint electrical signals of the brain that pass through the skull and scalp and pass these on to a differential amplifier that may amplify the signal a million times or more and convert the analog signal to a digital signal before passing it on to the computer. The electrodes

The figure above shows the placement of electrodes on the head based on the 10-20 system.
The digitized data is then analyzed by computer using specialized software designed to interpret the information and produce a color-coded map of the client's brain function. During the EEG data recording procedure, the client usually sits in a comfortable chair and is asked to simply sit still with eyes closed for a few minutes. The “eyes closed” recording is usually followed by a second recording with the eyes open and the client simply looking a single spot on the wall in front of him/her to minimize eye-movement. Sometimes recordings are also made while the client is doing some type of reading or mathematical calculation or visual puzzle task.
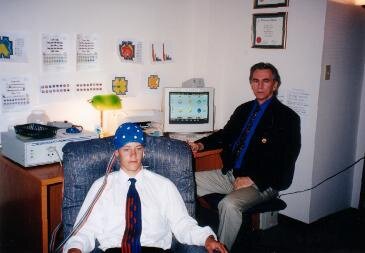
During the data acquisition phase of the EEG brain mapping, each of the sensors attached to the scalp collects the very faint electrical signals produced by neuronal activity within the brain, primarily from the outer layer or cerebral cortex directly underneath the electrode. The collected EEG data is then processed digitally and stored for later artifacting (i.e., removal of data segments contaminated by eye or muscle movement) and analysis. Once data collection is complete and the data are analyzed, the results can be shown graphically— most often in the form of colour-coded topographical brain maps such as the ones shown below.

Through this visual representation, areas of the brain showing more or less activity within a selected frequency band can be easily identified.
Most EEG brain maps show the distribution of EEG activity in amplitude (i.e., microvolts/hertz) or power (i.e., microvolts squared/hertz) units over the cortex in terms of a set of pre-defined frequency bands— namely, Delta (1-4 Hz), Theta (4-8 Hz), Alpha (8-12 Hz), SMR or Beta1 (12-16 Hz), Beta2 (16-20 Hz), Beta3 (20-24Hz), High Beta (24-32 Hz), and Gamma (38-42 Hz). Sometimes maps are produced for each single frequency from 1 to 40 Hz, called “single-bin” maps. Each map is colour-coded to show the amount of activity from lowest to highest. Maps are also sometimes produced to show other variables related to brain functioning such as left versus right power asymmetry, phase and coherence. These latter two are measures of the amount and efficiency of communication between different cortical regions.
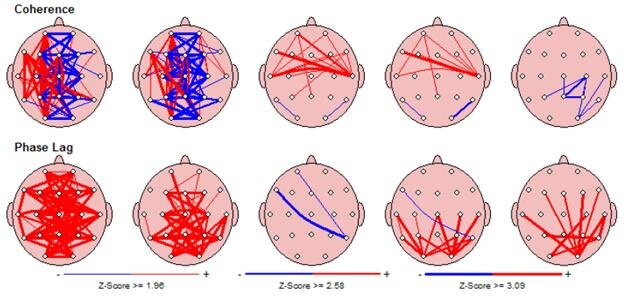
The primary use of QEEG is to examine patterns of brainwaves and help determine whether a person is an appropriate candidate for neurotherapy treatments focused on normalizing the EEG. QEEG alone does not render a diagnosis, but is designed to help the clinician make a more accurate diagnosis. QEEG is also not a substitute for clinical EEG and is a different process than that normally carried out by neurologists when they perform EEG assessments within hospital settings. Medical illness of the brain, such as seizure disorder, dementia, encephalopathy, brain tumour, lesion, hematoma and aneurysm should be diagnosed by a physician. QEEG is most effective in allowing the clinician to see functional problems of the brain that often underlie emotional and behavioural problems and in helping the neurotherapy practitioner individualize treatmet to the unique problems of each client.
For example, it is quite common for the QEEG to show abnormal EEG slowing in the frontal lobes, in particular towards the left side in the frontal lobe, in persons suffering with symptoms of depressed mood. When such an abnormal QEEG pattern is seen and clinically associated with depressive symptoms, EEG neurotherapy or neuromodulation focusing on increasing activation of the left frontal lobe is often indicated as a non-pharmaceutical treatment.
What is Neurometric Analysis?
The frequency composition of the normal healthy EEG recorded from every brain region is predictable and changes systematically with normal development and aging. Normative values have been statistically described and independently confirmed by researchers all over the world.
The results of these investigations have confirmed that statistically significant deviations from normal neurometric values are found in high proportions of patients with psychiatric illness, developmental disorders, cerebrovascular disease, early stages of dementia, and mild head injury, but significant abnormal findings seldom occur in normally functioning individuals. Obtaining such objective biological information can be an invaluable adjunct to patient evaluation, diagnosis, treatment selection and monitoring. [See Prichep & John, 1992 in Brain Topography, vol. 4, no. 4, pp. 249.]
[See P EEG neurometric analysis is the process of statistically comparing an individual’s QEEG data to “normative” data for his/her age and gender peers. A number of researchers and institutions have collected QEEG data from carefully selected sample populations of “normal” individuals as well as populations of persons identified as having certain psychoneurological problems such as ADHD, learning disabilities, traumatic brain injury, dementia, depression, bipolar disorder, anxiety disorders, obsessive-compulsive disorder, schizophrenia, and alcohol and substance abuse. Many of these QEEG databases are published, commercially available, and accessible to EEG neurotherapy practitioners for the purposes of comparing their client’s to one or more selected sample populations and, thereby, determining to what extent the individual client may differ from norms for his/her gender and age as well as to whether the client’s QEEG pattern is statistically similar to that of some identified diagnostic group.

Comparison of the individual client’s QEEG to normative data can be useful in the diagnostic process as well as in the planning of appropriate treatment. Specific QEEG signatures or patterns have been found and validated for a number of different disorders and some databases will permit a statistical pattern analysis of the individual client's QEEG data against a selected sample population and generate a statistical estimate of the extent to which the client fits the sample population. For example, a depressed client who has a history of mild head injury may be separately compared to samples of depressed individuals as well as head-injured individuals of the same gender and age to see to what extent the client’s QEEG pattern matches the QEEG signature for depression or head injury. Such an analysis may show that the depression is independent of the head injury or it might show that there clearly is a head injury that may explain the symptoms of depression. Treatment might vary dependent on the outcome of such comparisons.
As in the case of all psychiatric disorders, ADHD is diagnosed on the basis of the presence of particular behavioral symptoms that are judged to cause significant impairment in the individual's functioning and not on the basis of a specific test-- i.e., there is no "lab test" for ADHD, OCD, schizophrenia, depression, etc. However, the addition of QEEG findings to the currently accepted medical and behavioral evaluation can add significantly to the certainty of a correct diagnosis. In this regard, a number of research studies have shown that the accuracy of commonly used behavior rating rating scales in diagnosing ADHD range from a low of about 30% to a high of only about 60% (barely above chance) whereas QEEG findings are accurate in detecting ADHD about 90-95% of the time; with false positive rates of about 5% and false negative rates of less than 15%. [See Synder, et al., 2008 in Psychiatry Research, vol. 159, pp. 346-358]
For example, the QEEG brain maps (below) were produced with the NxLink database program (John, Prichep, Easton) and show the eyes-closed QEEG data of a 7 year-old female diagnosed with ADHD as compared to normative QEEG data for her age and gender. The topographs are colour-coded to show deviation from the norm in Z-score units; with very light blue indicating very much less than normal values (-99.9%tile), black indicating normal values (50%tile), and white indicating very much greater than normal values (+99,9%tile).
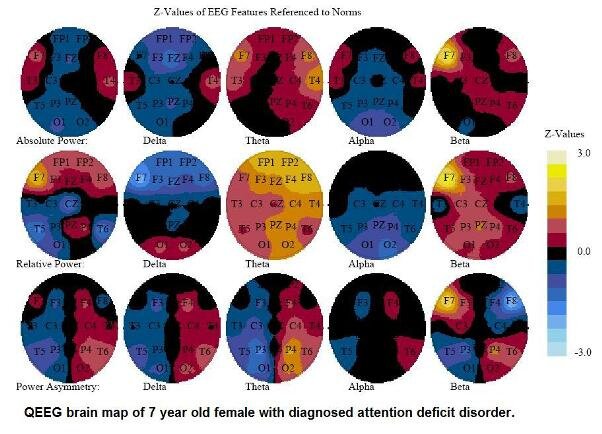
Examination of these topographs show that this child has higher than normal (about +2.5 Z-score units) relative amplitudes in the Theta (4-8 Hz) frequency band in the frontal area of the cortex (the warm yellow-orange colors in the middle topograph). Higher than normal amounts of Theta activity in the frontal regions of the brain are a hallmark of problems with attention and her QEEG brain map confirms her physician’s diagnosis of ADHD.
This child’s brain map suggests that EEG neurotherapy treatments should focus on reducing the excessive Theta activity seen in her frontal lobes. A treatment protocol that rewards decreases in the amplitude of 4-7 Hz EEG activity with simultaneous increase of 12-16 Hz EEG activity might be be effective with her.

The figure above shows the standard 10-20 system electrode placements and the basic brain functions that are located beneath each of the electrodes.
In summary…
QEEG Brain Mapping is a procedure that records electrical activity produced within the brain from sensors attached to the scalp. This brain map provides a baseline to work from while neurofeedback retrains the brain.
Neurometric analysis aids in obtaining a more precise view of subtle brain dysfunction. It provides multivariate information about the functional organization and disorganization of the brain and its normal development.
QEEG and neurometric analysis serves as a basis for identifying variations in brain function that are associated with different types of psychoneurological disorders including Attention Deficit Disorder, Autism, Learning Disabilities, Depression, Dementia, Mild Head Injury, Addictions, and Obsessive/Compulsive Disorder.
To view a brief video presentation on EEG recording and QEEG neurometric analysis, GOTO: https://www.youtube.com/watch?v=1ovv61mPHSI
We use this more objective, accurate and detailed information to create more effective neurodevelopmental training protocols and avoid brain training based on only limited information or educated guesses or theories about what the underlying problems and processes may be.
Benefits of the Procedure
The QEEG human brain mapping procedure is highly advanced and can offer more information than the typical electroencephalogram (EEG). By having a QEEG done, your brain activity can be compared to a wide database of other "normal brains," helping to determine which, if any, of your brain functions is actually abnormal. QEEG can be helpful in determining whether a person's symptoms are associated with specific brain dysfunctions and can guide treatment planning to save time, money, and energy. Repeated QEEG assessments can also be used to monitor treatment progress by showing changes in brain functioning as treatment progresses and symptoms change. QEEG has excellent time resolution and, with the use of LORETA algorithms, can also demonstrate good spatial resolution with respect to EEG signal sources. Lastly, EEG recording is completely safe... noninvasive, painless and radiation free.
Delimitations of the Procedure
It is important to understand that a QEEG is not the same as a "clinical EEG" which is used in medical diagnosis to evaluate epilepsy or determine if there is serious brain pathology, such as a tumor or dementia. Edmonton Neurotherapy does not use EEG or QEEG to make medical diagnoses. We use QEEG to evaluate the manner in which a particular person's brain functions and to help in developing an appropriate remediation plan to correct, normalize and/or improve abnormal brain functioning and reduce problem behavioural and psychological symptoms. In all cases where we see indications of any undiagnosed medical problem, we will refer the client back to their primary care physician for further evaluation and possible re-direction to a neurologist or other appropriate medical specialist.
While the QEEG may also provide valuable input to assist in the accurate diagnosis of various psychiatric-psychological conditions, in some cases with a high degree of sensitivity and specificity, it is a fundamental principle that no single method should be used alone to make a diagnosis or critical treatment/placement decisions.
Although Edmonton Neurotherapy does not require clients to be directly referred by a physician or other healthcare provider, we will only accept clients for neurotherapy who have previously consulted with their primary healthcare provider about the specific problem(s) for which they are seeking neurotherapy. In all cases where a prospective client is being actively treated by another healthcare provider, we will insist that the client permit us to contact the other treatment provider to appropriately coordinate treatment.
Using Previously Recorded Clinical EEG Data for QEEG Processing
Many clients who wish to begin EEG neurofeedback treatment have had a prior EEG recording done at a hospital or medical clinic (i.e., clinical EEG), usually at the request of a neurologist. These clients often ask if we can use this previously recorded clinical EEG data for our quantitative analysis. Unfortunately there is no widely accepted or uniform technical standard for the file formatting of digital EEG recordings and, while our analysis software accepts a number of different formats, there are many that it cannot import data from. There are also a number of other technical issues that commonly make it very difficult to use previously recorded clinical EEG data for our QEEG procedures. In the majority of cases, it is more efficient and cost effective to repeat the EEG recording specifically for the purpose of QEEG analysis.
Medications and Consultation with Your Physician
Since the QEEG neurometric analysis procedure compares the client's EEG to gender and age-appropriate norms derived from samples of "normal, healthy, unmedicated individuals", accurate interpretation of results requires that the client also be medication free or reduce their medications as much as possible prior to having their EEG recorded. In the case of OTC medications, recreational drugs, or nutritional substances (e.g., alcohol, coffee, tea, etc.) that have central nervous system effects, the client can simply reduce or stop these on his/her own as requested. However, in cases where clients are taking physician-prescribed medications or nutritional supplements or herbs under specific direction of a healthcare practitioner, it is absolutely essential that clients consult with their healthcare provider before making any changes to the frequency or dose of their medications.
It is also important to understand that many medications cannot simply be stopped without first slowly decreasing the dose taken over a period of time. Weaning off some medications prior to actually stopping them can sometimes take a number of weeks and should be done under the supervision of the healthcare provider that prescribed the medication.
Supporting Literature:
Duff, J. (2004). The usefulness of quantitative EEG (QEEG) and neurotherapy in the assessment and treatment of of PTSD. Clinical Electroencephalography & Neuroscience, 35(4): 198-209.
Duffy, F. (1989). The clinical value of topographioc mapping and quantified neurophysiology. Archives of Neurology, 46:1133-1134.
Johnstone, J., Lunt, J. (2011). The use of quantitative EEG to predict therapeutic outcome in neuropsychiatric disorders. In Coben, R. & James, R. (Eds). Neurofeedback and Neuromodulation Techniques and Applications, (pp. 3-24) New York, NY: Academic Press.
Prichep, L., Mas, F., Hollander, E., et al. (1993). Quantitative electroencephalography subtyping of obsessive-compulsive disorder. Psychiatric research: Neuroimaging, 50(1):25-32.
Thatcher, R. (2010). Validity and reliability of quantitative EEG (QEEG). Journal of Neurotherapy, 14 (2): 122-152.
Thatcher, R., Biver, C., Carl, J., et al. (2003). Quantitative EEG and the Frye and Daubert Standards of Admissibility. Clinical EEG, April 2003.
Thatcher, R., Lubar, J. (2009). History of the scientific standards of QEEG normative databases. In Budzynski, T., Budzynzki, H., Evans, R., Abarbanel, A. (Eds). Introduction to Quantitative EEG and Neurofeedback: Advanced Theory and Applications, 2nd Edition. (pp. 29-62). New York, NY: Academic Press.
Thatcher, R., Walker, B., Biver, C., North, M., Curtin, R. (2003). Sensitivity and specificity of an EEG normative data base: Validation and clinical correlation. Journal of Neurotherapy, 7 (3/4): 87-121.
Tramontano, G. (2006). QEEG testing can discern reason for cognitive disorder: Digital EEG recordings of brainwaves can determine TBI etiology. Connecticut Lawyer, March 2006, pp.14-16.
To download a brief document with information on how to prepare for your QEEG assessment, GOTO: Preparing for Your QEEG
To book a QEEG assessment or to request more information on the procedure and whether it might be of benefit to you, contact Dr. Horst Mueller, RPsych by email: [email protected]